Meet the winners of the Visualizing research at SciLifeLab Campus Solna contest
If you have not seen all the submissions yet, make sure to check them out here!
As a final note to the three day online event “Science Talks” at SciLifeLab, the winners of the Visualizing research at Campus Solna contest were announced. With stunning visuals and clever use of technology, all participating researchers revealed an amazing world otherwise hidden from the naked eye. Five participants were announced winners by popular vote and will be awarded a chance to work with professional illustrators Ella Maruschchenko, Beata Edyta Mierzwa, and Jeroen Claus to make their next great cover image.
We asked the winners to answer a few questions on their contributions, and so, without further ado, we present the winners and their reflections on their artwork!
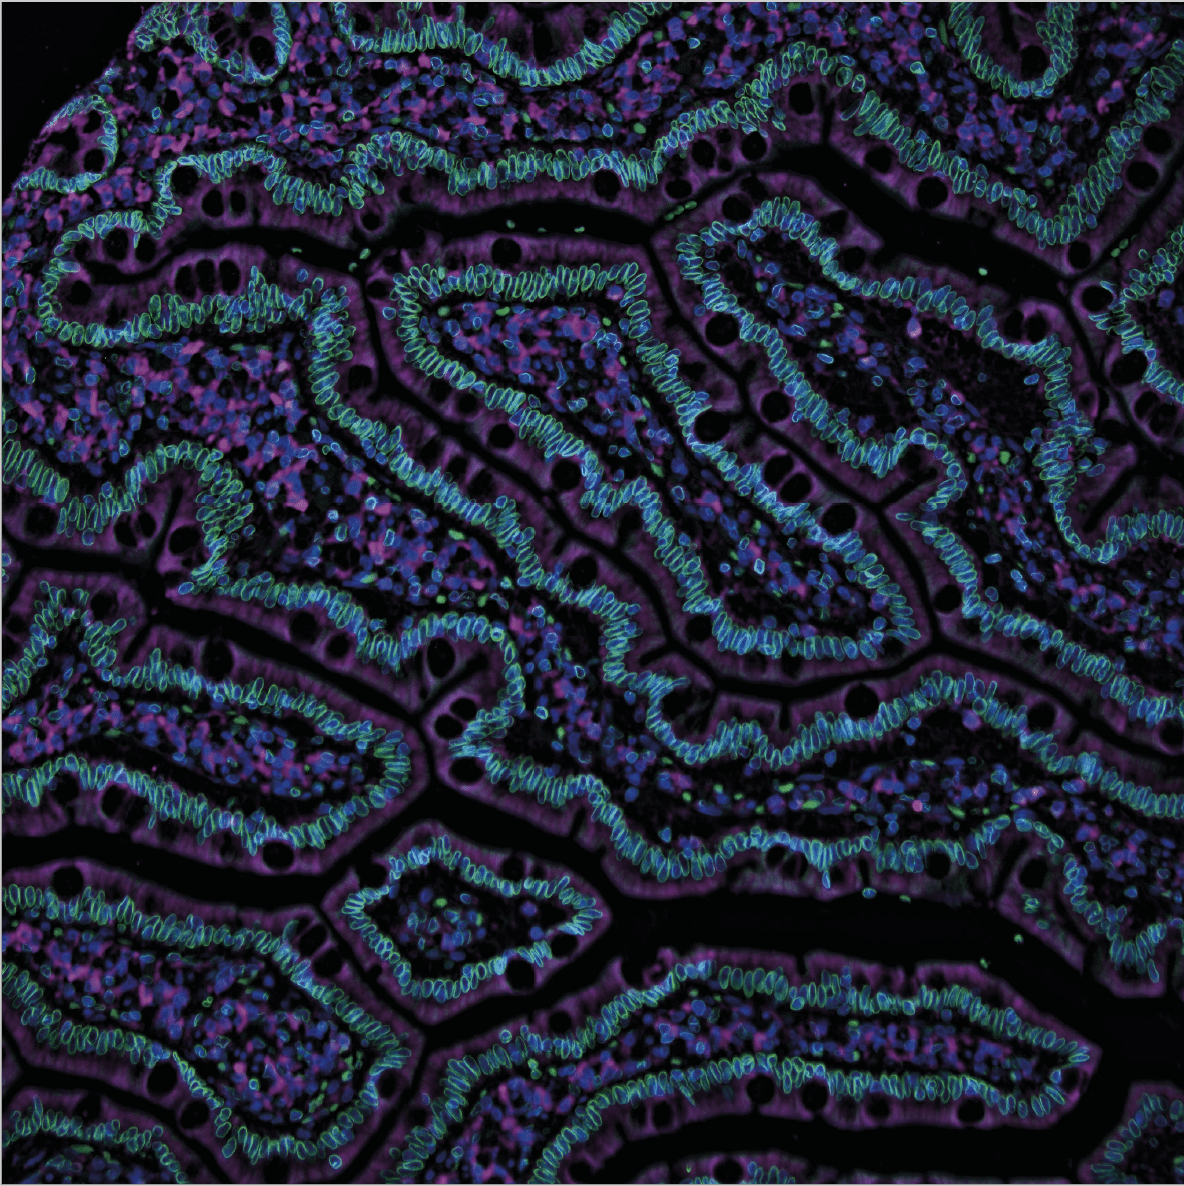
Anna Bäckström – Immunofluorescent staining on healthy human duodenum tissue
What does your image portray?
“My picture depicts healthy tissue from the part of the small intestine that is called the duodenum.”
How does it relate to your research?
“Part of our research is focused on showing where you can find different proteins inside the body’s cells. In this picture, you can see an example of a protein in the nuclear envelope (green). The cell nuclei are colored in blue, and the microtubules in magenta.”
What is your personal reflection regarding your winning contribution?
“The intestinal tract is not associated with beauty in general, but here it gets redeemed! There are few things that makes you more satisfied than a good picture.”
Hjalmar Brismar – Lily of the Valley

What does your image portray?
“This is a test specimen that we use to check the function and performance of our microscopes. It is a multispectral recording done with a confocal microscope of the root tip of a lily of the valley (Latin: Convallaria majalis). The preparation is stained with the dye saffranin which emits fluorescence with different colors in different structures of the cell walls.”
How does it relate to your research?
“The image is connected to our research insofar that it confirms that we have been successful in aligning the microscope perfectly, but otherwise, it does not have much to do with our research in cellular biophysics.”
What is your personal reflection regarding your winning contribution?
“The picture reminds me of the origin of the word “cell” that Robert Hook used in 1665 for the first time in his book “Micrographia”. He used an early variant of a microscope to describe various objects in his environment. Among other things, he observed thin slices of cork and described what he saw as cells, similar to monks’ cells in monasteries.”
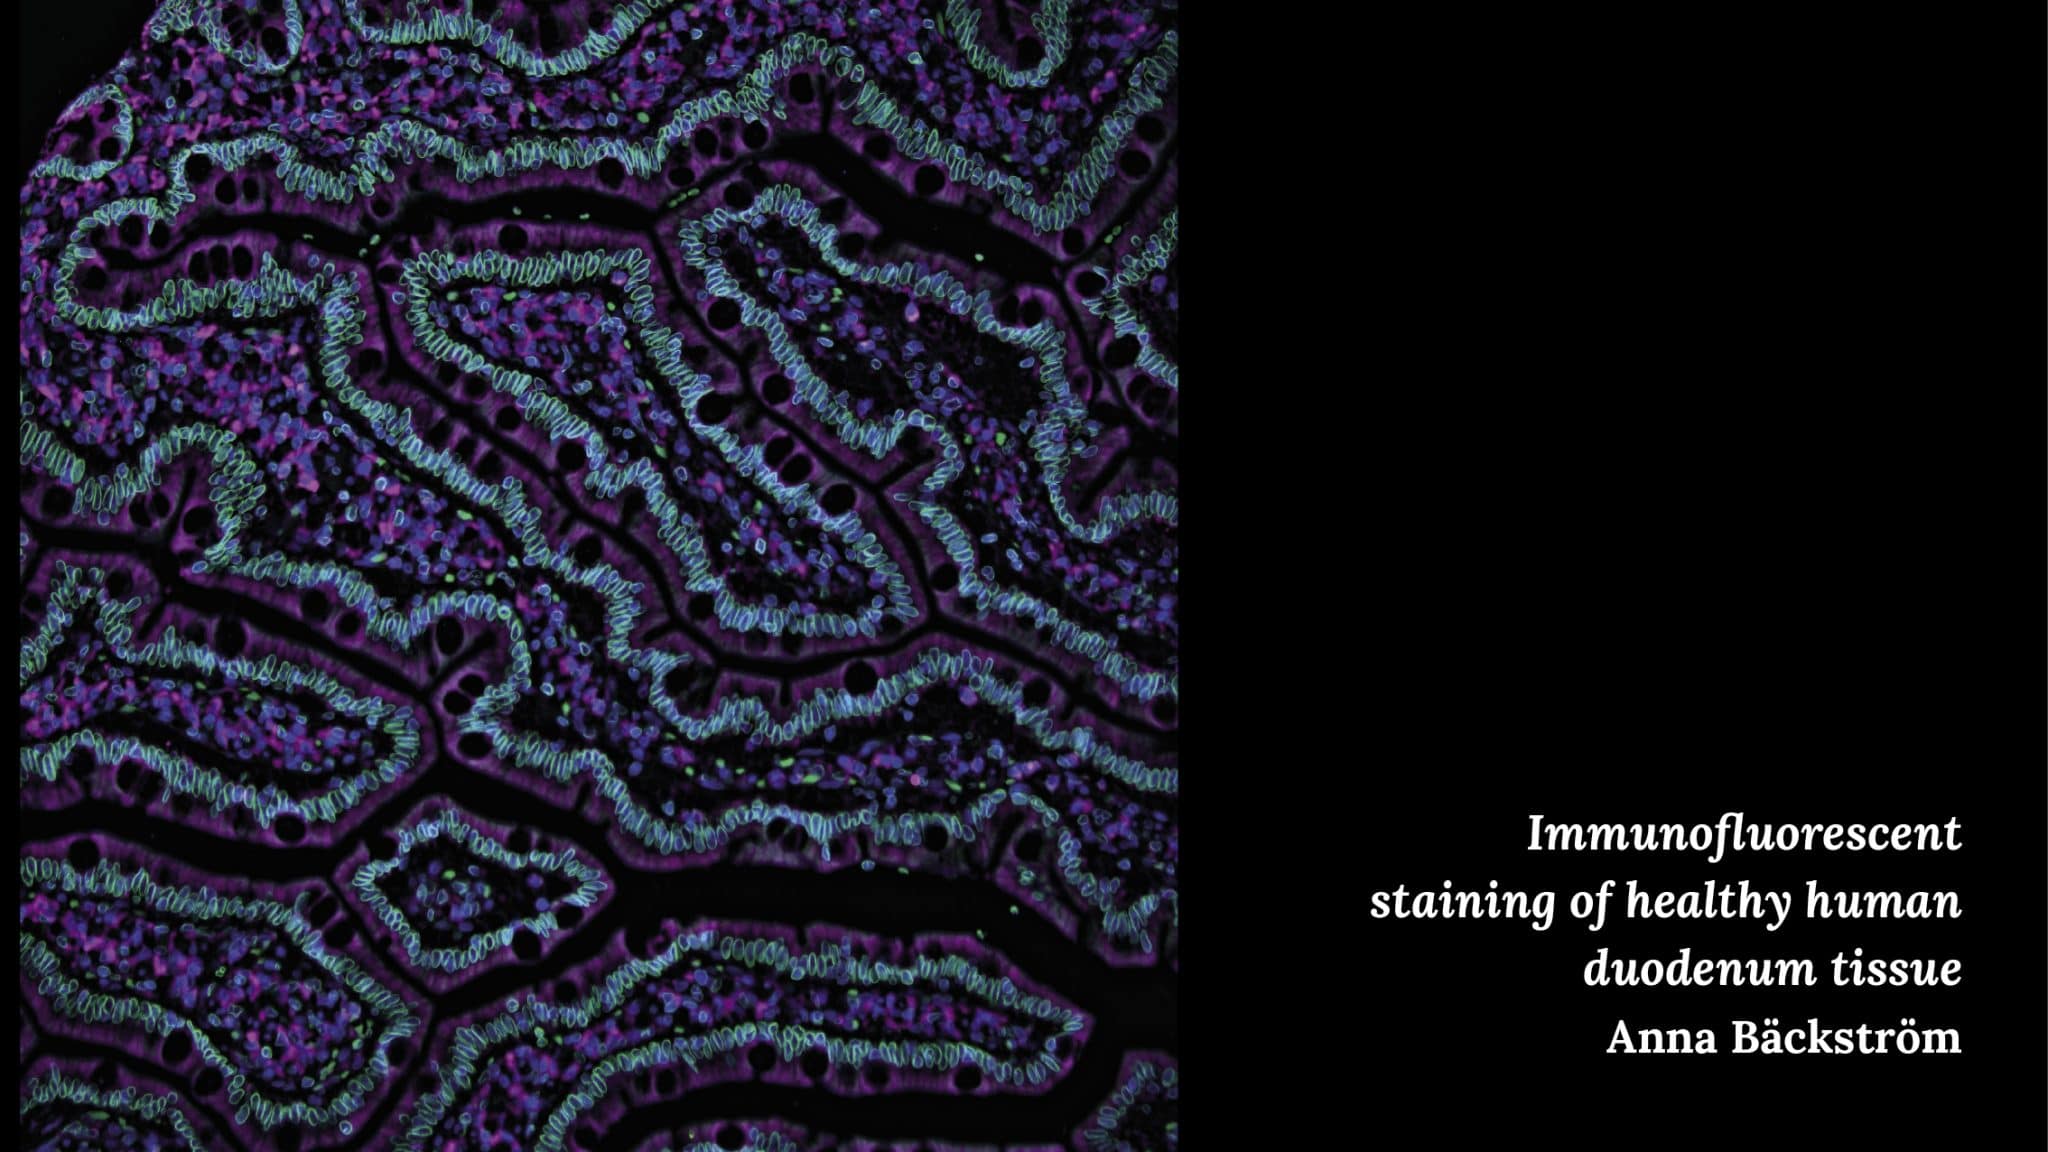
Giovanna Coceano – Dancing mitochondria and Fibroworks

What do your images portray, and how do they relate to your research?
“Fibroworks – an unconventional view of a migrating cell is a three-color STED image of a cancer cell, in which actin (cyan), vimentin (yellow) and phosphotyrosine (magenta) are labeled. The image is the result of a published collaboration in which we demonstrated that vimentin levels control cell shape and focal adhesion size, but not the speed of cell migration in highly migratory, transformed mesenchymal cells.
Dancing Mitochondria is a three-color confocal image of mitochondria (cyan), microtubules (yellow) and cell nuclei (magenta). Mitochondria are highly dynamic and one of the most abundant organelles in the brain, and crucial for neuronal activity. We are currently applying super resolution microscopy to understand the details of mitochondrial protein organization at the nanoscale.”
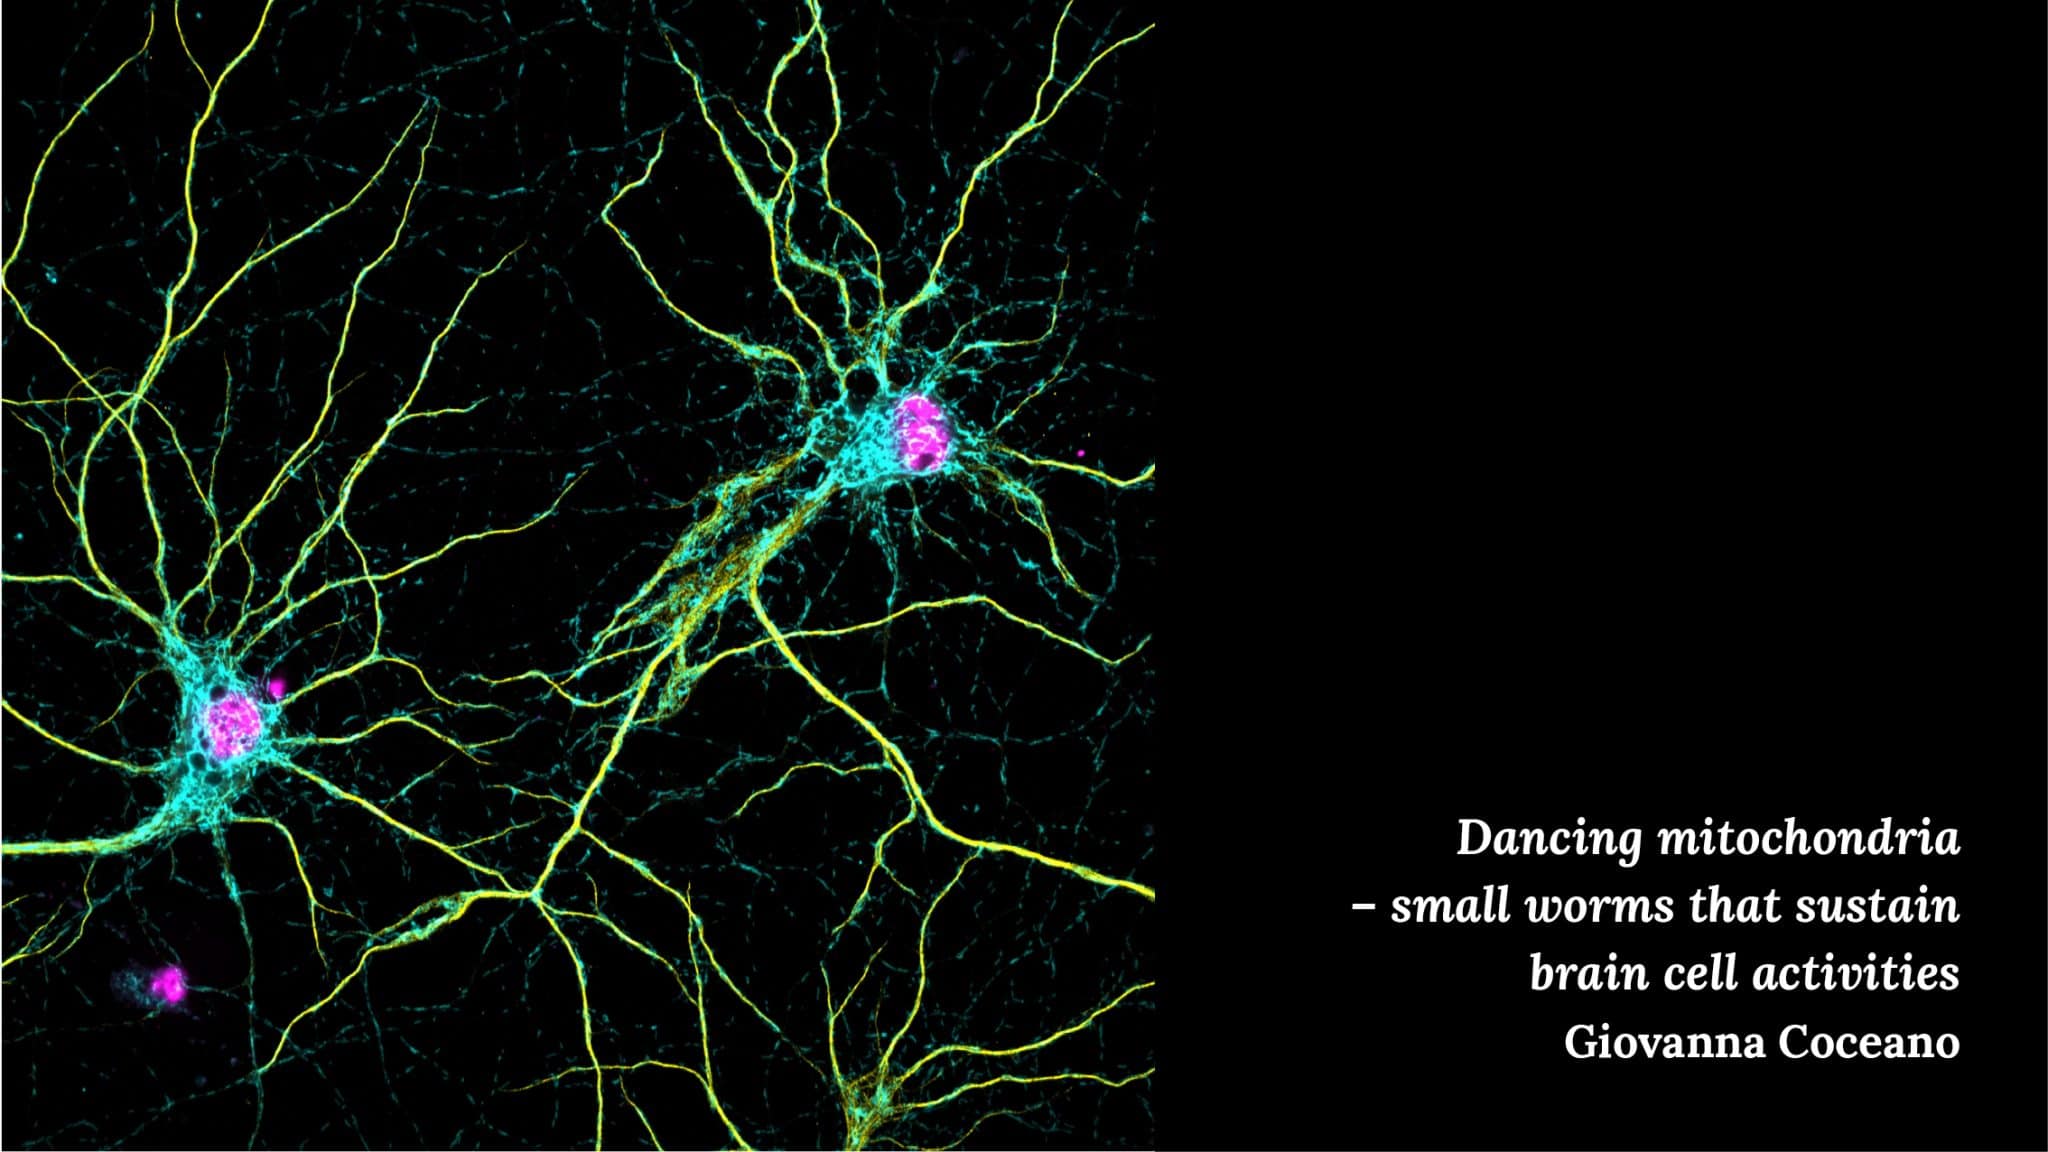
Inna Sitnik – Artistic representation of IF image RRs in U-2 OS cells
What does your image portray?
“It is an artistic transform of an confocal microscopy image of fluorescently labeled U-2 OS cells, where nuclei are displayed in cyan, microtubules in magenta and rods and rings (RRs) – a poorly characterized cytoplasmic structure – in green.”
How does it relate to your research?
“This particular image was produced when we carried out a set of experiments, where we wanted to check if it will be possible to detect autoantibodies against RR:s in sera from COVID-19 patients. Since, some of the COVID-19 interacting proteins are localized to the RR:s and autoantibodies against RR:s have earlier been reported to be detected in serum of patients with other RNA virus infections, we thought that similar manifestation could be relevant to COVID-19 infection. This image is showing one of the positive controls, where we treated U-2 OS cells with ribavirin to induce formation of cytoplasmic RR:s and then applied fluorescently labeled antibodies against IMPDH1/2 in order to visualize them.”
What is your personal reflection regarding your winning contribution?
“Every time I start up the microscope, I don’t know what I am going to see. But one thing I never have any doubts about – it’s definitely going to be something beautiful. And the little tadpole in this picture demonstrates that science is not only beautiful but also amusing sometimes!”
Mattias Vesterlund – SubCellBarCode

What does your image portray?
“The image portrays a correlation network of proteins based on their subcellular localization, i.e. where they are located inside the cell. We fractionated five different cell lines to extract different parts of the cells and then analyzed those fractions by in-depth mass spectrometry. From the quantitative data, we then calculated correlations and made the network. In total there are more than 7000 proteins in the network and about 60 000 edges (connections between the proteins). The colors are based on a network clustering method and correspond to different parts of the cell: Blue (Cytosol), Green (Nuclear), Yellow (Secretory), Pink (Mitochondria).”
How does it relate to your research?
“This was part of a large project which we published as a resource in Molecular Cell last year. We cataloged and classified the subcellular localization of 12 418 proteins across five human cell lines and demonstrated that the method also can be used to study relocalizations and protein shuttling in response to treatments and perturbations on a global scale. The full data and useful tools to explore it is freely available at www.subcellbarcode.org, where you can both find information on individual proteins, protein complexes and download the full dataset.”
Presently we are working on making use of the method in our other projects, in particular in relation to cancer. I believe that adding knowledge on where proteins are and how they move will help increase the understanding of many diseases and hopefully lead to improved treatments for patients.
What is your personal reflection regarding your winning contribution?
“The SubCellBarCode-project was very rewarding teamwork which we carried out within the group. We tried several different methods to analyze and visualize the dataset we generated, almost everything proved to give great results so we spent many hours intensely debating metrics and details of the analysis pipeline. In the end, we went for a different method for the classification pipeline. But the network image, to me, represents a powerful and visually appealing depiction of the dataset. It both reveals the organization and spurs further curiosity.”